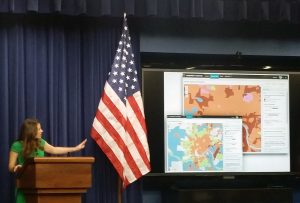
Chris Fulcher and the rest of the Community Commons team are no strangers to visiting the Washington, D.C., area for meetings, conferences and seminars, but before January they had never been asked to make a presentation at the White House. That changed when the team received an invitation from the White House Innovation Fellows Program to take part as one of 12 organizations from around the country in the inaugural running of “The Opportunity Project.”
The initiative, a collaboration spearheaded by the White House with support from the Department of Housing and Urban Development (HUD) and the Census Bureau, challenged the groups to take previously unreleased information and create new data tools that can be used to show clear growth opportunities for families — all within the time frame of six weeks. The organizations would then present the end results of their work at an event at the White House March 7.
After receiving the data, the team at Community Commons, which includes the Center for Applied Research and Environmental Systems (CARES) housed in Mumford Hall, created its most innovative mapping tool yet: the Location Opportunity Footprint Tool.
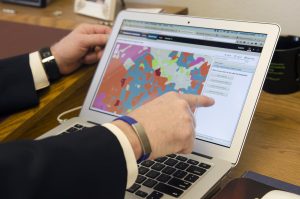
LOFT, as it is also called, builds upon the organization’s Community Health Needs Assessment Tool (CHNA) and allow users — who in this case would most likely be neighborhood leaders looking to find ways to ways to make business investment proposals in their communities — to identify new indicator thresholds of opportunity based on the resulting overlap of data points collected on school proficiency index scores, job opportunities (based on a given area amount per worker) and low monthly housing and transportation costs. Areas that meet all three thresholds are shaded in red. Those that meet two are in orange. (see photo on the left).
“It not only helps you find some economic optimal locations, but then it is linked now to a needs assessment to help you understand all of the data related to that specific area,” said Fulcher, who serves as director of CARES in the Division of Applied Social Sciences.
Furthermore, users can then take these newly created data footprints and customize them based on each factor. The footprints can then be saved, shared, printed or viewed next to other additional data layers. The footprints can then be used to create a variety of reports, including a Comprehensive Indicator Report that can add in up to 120 different indicators from federal agencies.
“LOFT was very well received,” Fulcher said. “The White House staff came up to us and said that we had really pulled something together that was unique.” The LOFT tool is fully operational nationwide.
A growing movement
Fulcher was accompanied to D.C. for the event by Angela Johnson, who works as an analyst at CARES, and Erin Barbaro, a product manager at the Institute of People, Place and Possibility (IP3). IP3 is a Columbia-based organization that initiated Community Commons in 2012 with the help of MU, among other collaborators. Barbaro gave the main presentation (which can be viewed here, the presentation starts at 1:32:33 mark) while all three helped give demonstrations after all of the presentations were given.
“I think what’s really special is that the team who did the heavy lifting on this project presented,” said Fulcher, who also mentioned that Yan Barnett of CARES also played a vital role in the creation of LOFT. “It was truly a team effort.”
When Community Commons started in 2012, it started out with a few thousand users. That number has now mushroomed into approximately 35,000 users, according to Fulcher. The biggest surge in growth has taken place over the last two years. “It’s night and day,” Fulcher said in regards to the current operations compared to when the initiative began. He hopes for the users to number in the hundreds of thousands within the next four years.
Although the “Hubs” section on its website contains custom areas around targeted issues that provide a steady revenue stream from foundations and other social sector organizations, Fulcher said that at its core Community Commons “serves as a public good utility” that includes data, mapping and reporting tools, and digital storytelling.
At no monetary cost, public registered users can access thousands of different geographic information system (GIS) map layers for the entire country that include poverty, education attainment, income, legislative and congressional districts, and many and other environmental, health and education data sets that can provide new insight on the infrastructure of vulnerable populations. The no-cost accessibility of data from Community Commons stands in contrast to the business models of many of the other counterpart mapping organizations, Fulcher said, that often use a subscription model.
“How do we help communities across the United States better understand people and place? It’s not just about health,” Fulcher said. “It’s not just about economic development. It’s not just about education, but it’s the overlap of all those different activities and the complexity related to it that helps people explore their communities and regionin unique ways with the tools we have.”